Menu
Navigation
Home
Daily Briefing
Search
Newsletter
Categories
Power BI
Data Strategie
Visualisatie
AI & Analytics
Markt & Trends
Knowledge Base
Knowledge Base — Routes & Guides
BI Info
All articles
/
Visualisatie
/
different takeaway, different graph
Visualisatie
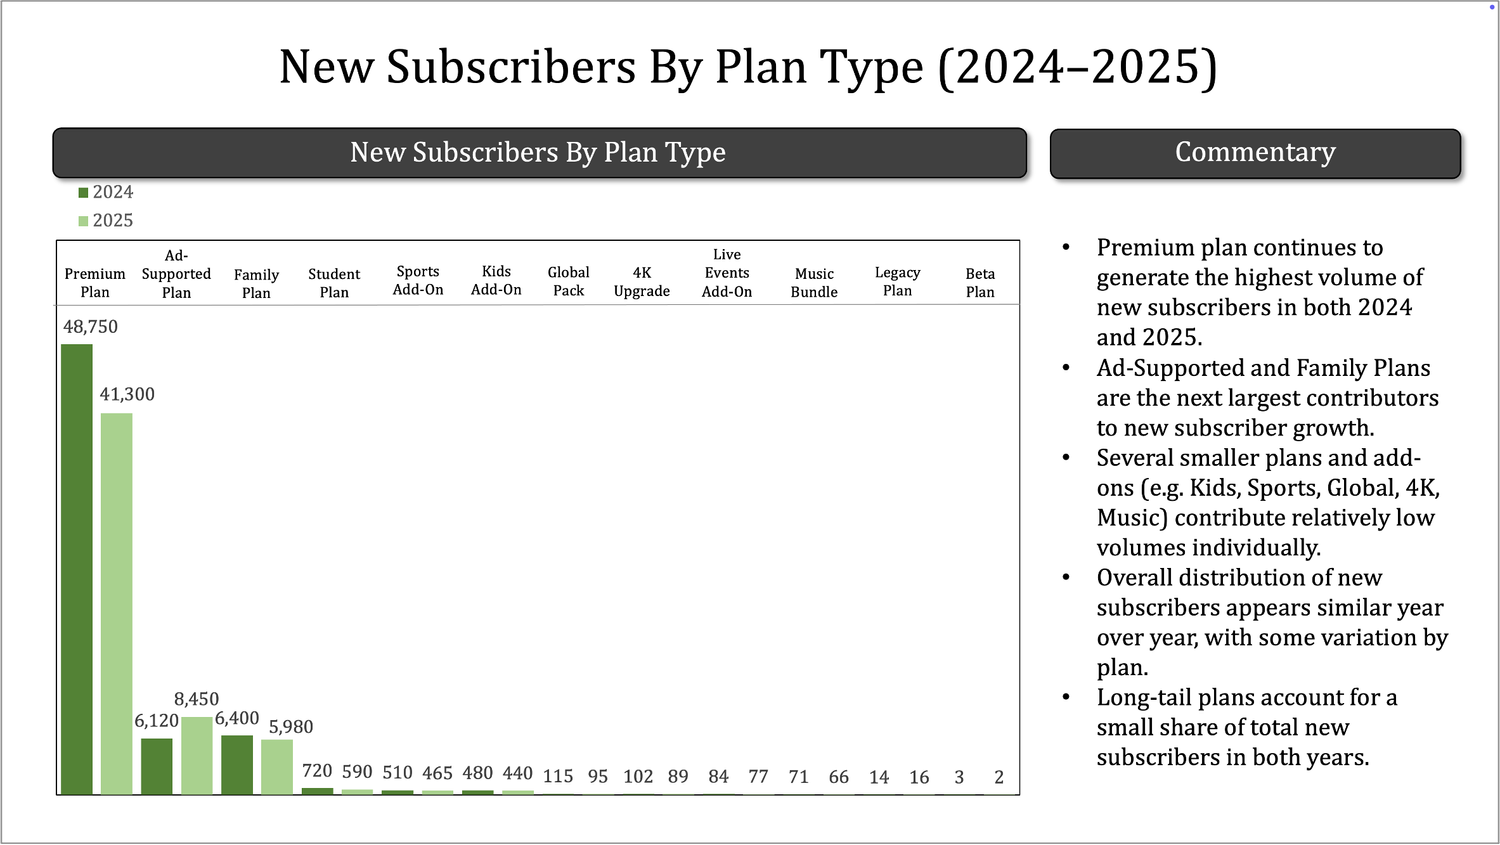
different takeaway, different graph
Storytelling with Data
19 Feb 2026, 19:28
Summary
One chart for all rarely works: how the same data tells clearer stories with different charts.
Read the full article
Related articles
Storytelling with Data · 9 Mar 2026
translate for your audience
Storytelling with Data · 3 Mar 2026
The Collaborative Blueprint: The Open Visualization Academy as a Community of Learning and Friendship
Storytelling with Data · 3 Mar 2026
be careful using questions as slide titles
Storytelling with Data · 2 Mar 2026
Teo Popescu Named New Managing Editor of Nightingale