Samenvatting
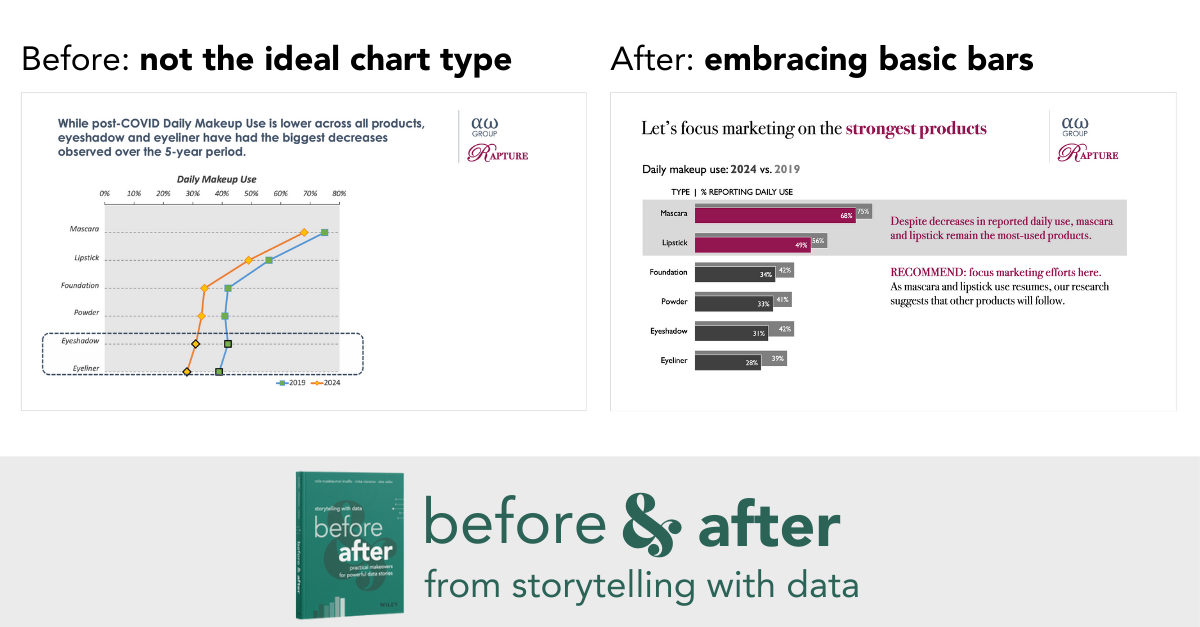
When do you use bar graphs and when do you use line graphs? Two makeovers that show how design choices sharpen your message.
Deepen your knowledge
Knowledge Base
Dashboard Design — 7 rules for effective data visualization
Learn the 7 golden rules for effective dashboard design. From choosing the right chart type to visual hierarchy and user...
Knowledge BaseWhich chart type to choose? The complete decision tree
Bar chart, line chart, pie chart, or scatter plot? Discover which chart type to use when with our practical decision tre...
Knowledge BaseStorytelling with data — From numbers to compelling narrative
Learn how to turn data into a compelling story. Discover the three ingredients of data storytelling, the SCQA framework,...