Summary
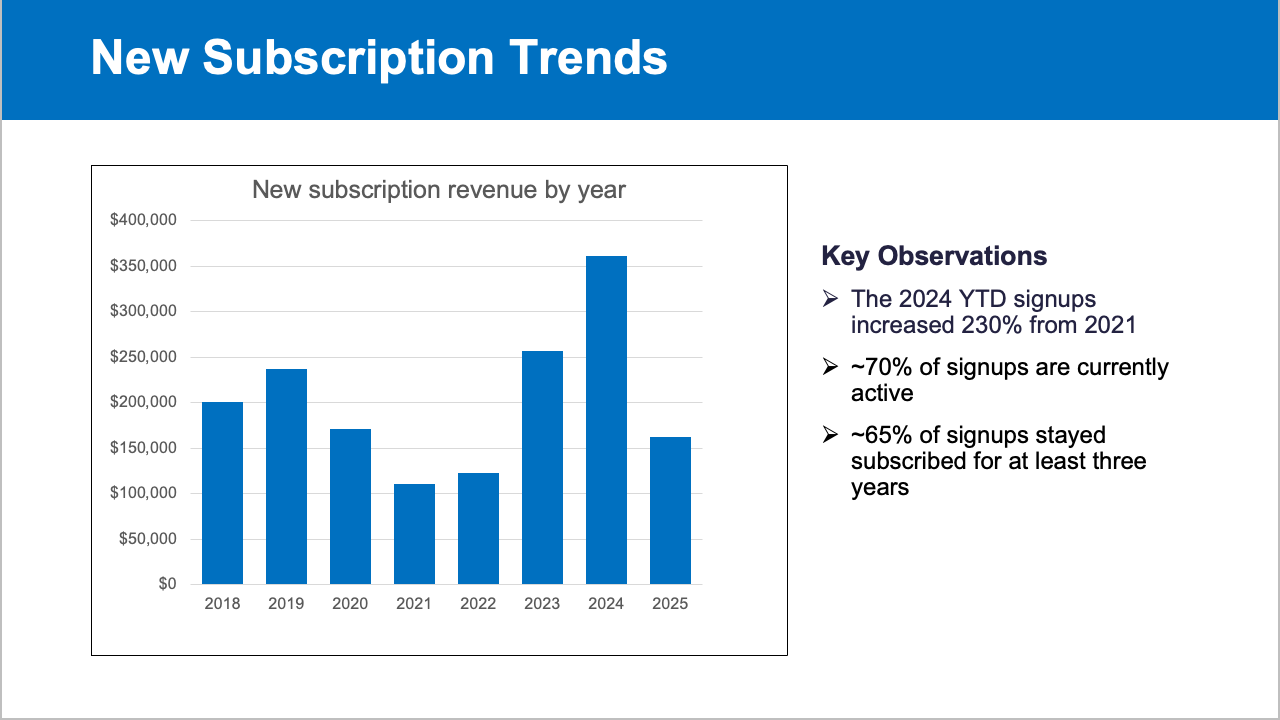
How to present incomplete data: context and design to avoid confusion about incomplete reporting periods.
Deepen your knowledge
Knowledge Base
Dashboard Design — 7 rules for effective data visualization
Learn the 7 golden rules for effective dashboard design. From choosing the right chart type to visual hierarchy and user...
Knowledge BaseStorytelling with data — From numbers to compelling narrative
Learn how to turn data into a compelling story. Discover the three ingredients of data storytelling, the SCQA framework,...
Knowledge BaseWhat is Power BI? Everything you need to know
Discover what Microsoft Power BI is, how it works, what it costs, and why it's the world's most popular BI tool. Complet...