Part 3 of Curbal's Power BI football project: setting up a proper data model.
News Archive
January 2026 — 64 articles
Apr '26 (817)
Mar '26 (948)
Feb '26 (171)
Jan '26 (64)
Dec '25 (39)
Nov '25 (23)
Oct '25 (23)
Sep '25 (21)
Aug '25 (14)
Jul '25 (12)
Jun '25 (13)
May '25 (15)
Apr '25 (19)
Mar '25 (8)
Feb '25 (2)
Jan '25 (4)
Dec '24 (4)
Nov '24 (3)
Oct '24 (5)
Sep '24 (6)
Aug '24 (1)
Jul '24 (5)
Jun '24 (2)
Mar '24 (8)
Feb '24 (6)
Jan '24 (8)
Dec '23 (6)
Nov '23 (6)
Oct '23 (5)
Jun '23 (1)
May '23 (1)
Apr '23 (1)
Mar '23 (3)
Nov '22 (3)
Oct '22 (1)
Oct '21 (1)
Apr '21 (2)
Mar '21 (3)
Feb '21 (2)
Apr '19 (2)
Mar '19 (2)
Feb '19 (4)
Jan '19 (2)
Dec '18 (4)
Nov '18 (6)
Oct '18 (11)
Power BI (22)
Data Strategie (18)
Visualisatie (10)
Markt & Trends (8)
AI & Analytics (6)
Friday, January 30 (3)


BNR news update on deeptech challenges: the long road from lab to market-ready product.
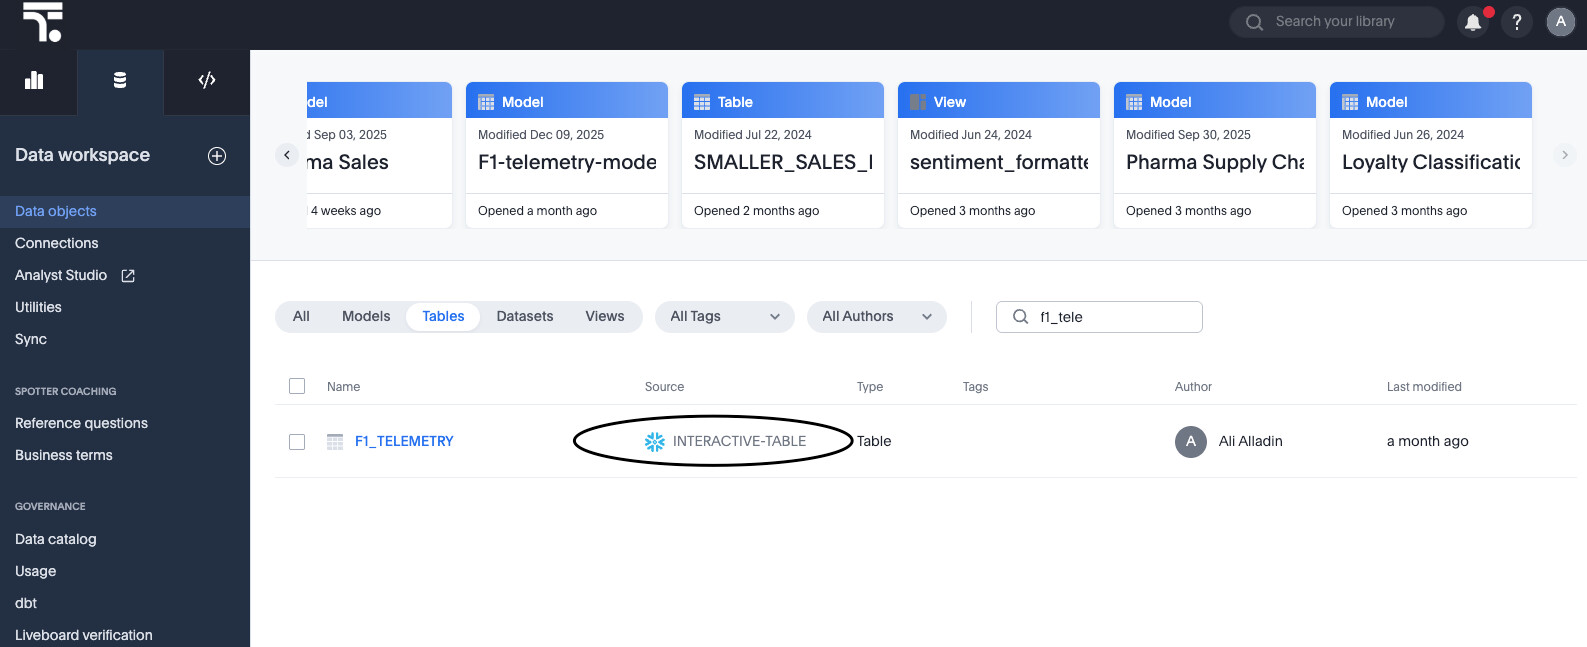
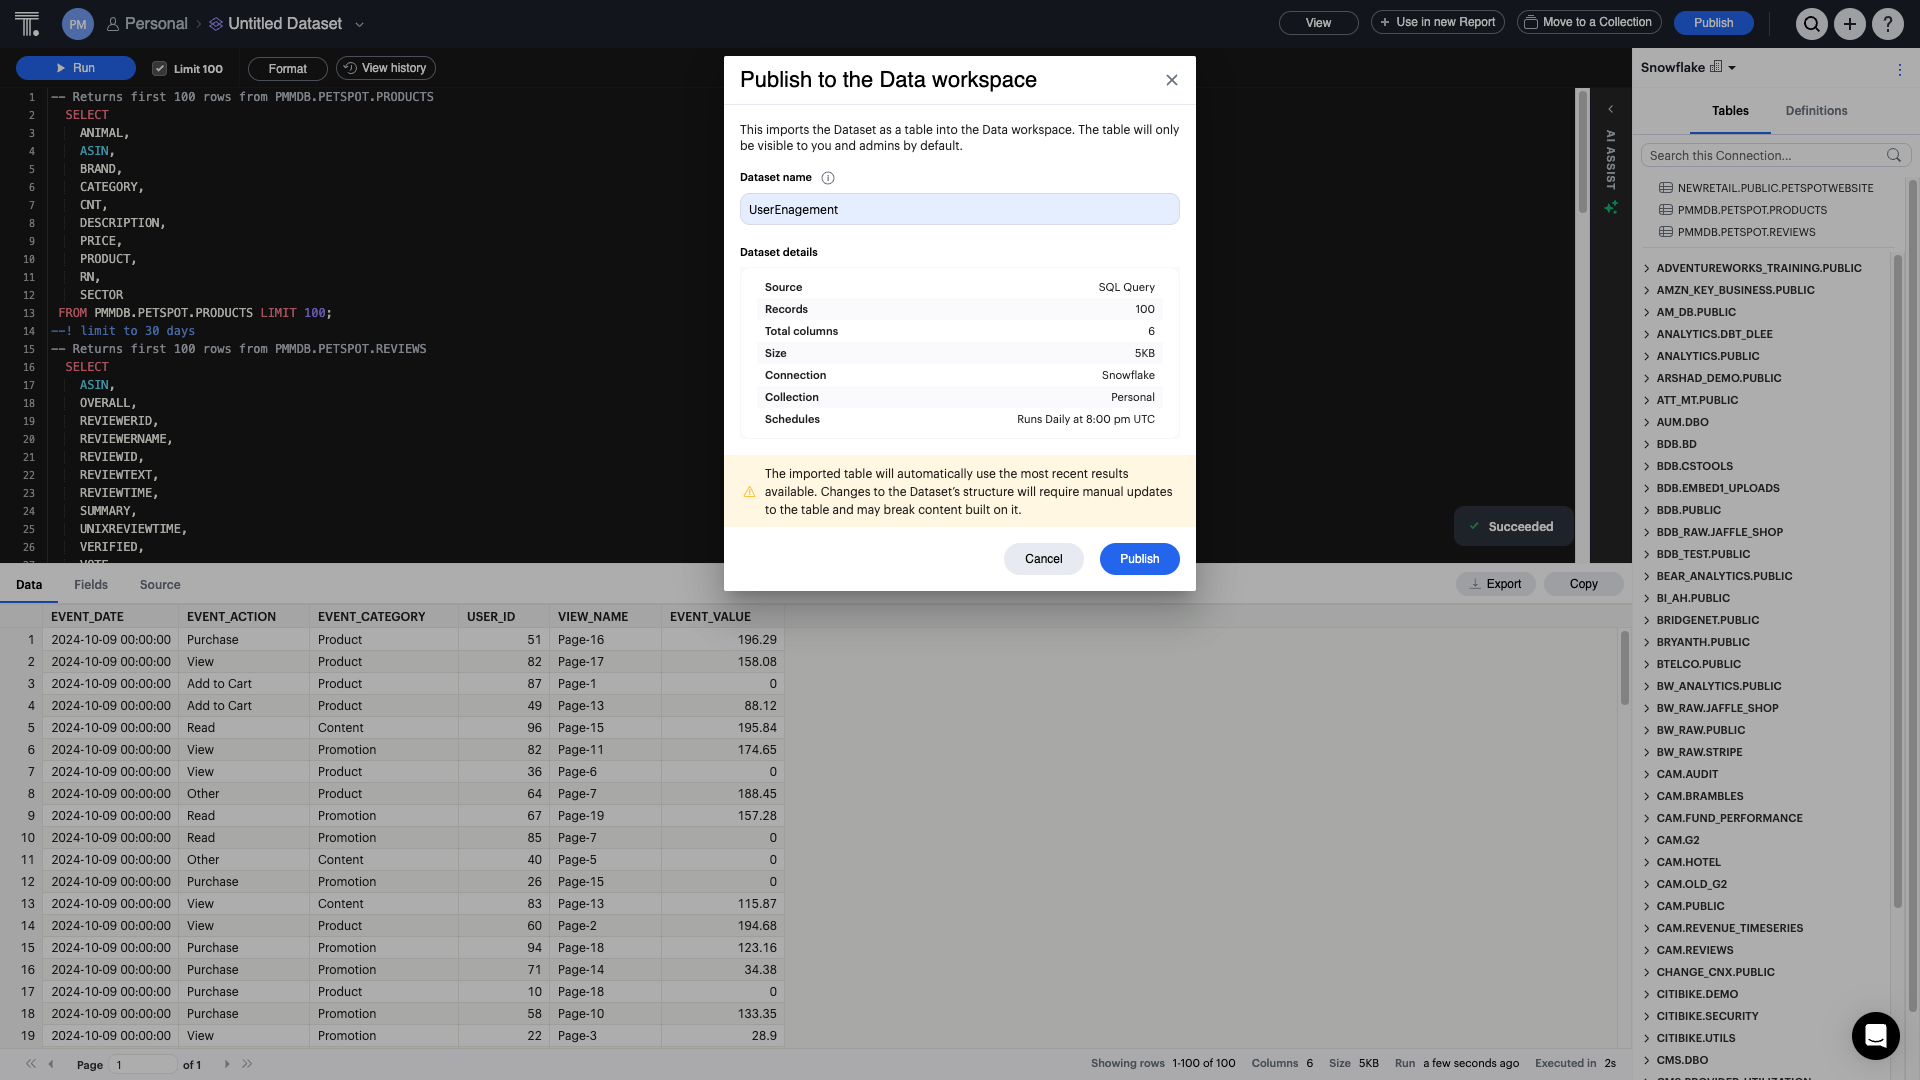
Snowflake Interactive Analytics provides ThoughtSpot users with seamless integration to receive answers promptly during …
Thursday, January 29 (3)

The Open Semantic Interchange (OSI) specification for semantic portability and its impact on metrics and AI.

Why AI prompting in analytics works differently than you'd expect, and why Power BI has an edge here.

A critical look at the Gartner Hype Cycle: how useful is the model for describing technology hypes?
Wednesday, January 28 (1)
SpotCache provides a solution for data leaders struggling with unpredictable cloud costs associated with AI usage. This …
Tuesday, January 27 (2)

How to show transaction details in a matrix column in Power BI for deeper insight into the underlying data.
Call for Presentations for dbt Summit: share your data story with real problems and solutions. Deadline March 31.
Monday, January 26 (5)

Genetec shares best practices for data protection of physical security systems around Data Protection Day.
Why centrally defined metrics are essential for AI success and how to build a consistent metrics framework.

Technique to display transaction details from multiple columns in a single matrix column using a DAX measure.
Six common profit leaks for businesses using an hourly billing model, and how to fix them.

Modern visual tooltips in Power BI are now generally available, improving report interaction.
Sunday, January 25 (2)
Everything about Apache Iceberg and the catalog layer: open table formats explained by an Apache committer.

DAX performance tip: Calculate() with filters on value 0 can block DAX Fusion. Learn how to optimize this.
Saturday, January 24 (1)
Solution for the 'Black Icons' issue in Power BI Desktop January 2026, explaining the cause and a temporary workaround.
Friday, January 23 (3)

Improve busy lists by restructuring content instead of editing it for better readability.

Part 2 of Curbal's Power BI football project: retrieving data from an API.
BNR news update with five predictions about the role of AI in 2026.
Thursday, January 22 (5)

This video explains when variables in DAX are evaluated, a crucial aspect for BI professionals working with Power BI. It…

A data visualization book for kids: Christine and the Magic Charts makes charts accessible to young readers.

Advanced Power BI technique: applying interactive filters in a matrix for dynamic reports.

Power BI has introduced the EXPAND and COLLAPSE features for visual calculations, allowing users to present and design d…
Digital literacy should start at school: teaching children to navigate technology and online information.
Wednesday, January 21 (6)
How Sweetgreen converted unstructured data into conversational analytics with dbt and AI for reliable insights.
The role of the semantic layer in data governance and security for reliable analytics at scale.

ADE benchmark measures how AI agents perform data work, with realistic benchmarks against popular LLMs via dbt.

The dbt Fusion engine saves 29%+ on warehouse costs through smarter compute optimization.
Atlan rebuilt its Apps Framework to facilitate the transformation from product to platform. This decision was driven by …

Overview of new features in Power BI Report Server January 2026, with improvements in reporting and visualizations.
Tuesday, January 20 (4)

Explaining your job is an opportunity for data storytelling: three techniques to explain what you do.

An analysis of supermarket product placement using the Synoptic Panel in Power BI, enabling visual optimization of store…
Azure Maps for Power BI introduces Markers: a new way to create data-driven location stories without complex GIS tools.
Power BI January 2026 update with new reporting tools, smarter data modeling, AI/Copilot improvements, and key announcem…
Monday, January 19 (1)
A scientific look at what makes start-ups successful: from idea to a compelling business case for investors.
Sunday, January 18 (1)

How to measure the rendering time of image visuals in Power BI with Performance Analyzer, separate from DAX query perfor…
Saturday, January 17 (1)

Curbal launches a new Power BI project around football leagues using API data, including guidance on setting up an API k…
Friday, January 16 (1)
BNR update on the role of intuition in business and how gut feeling can serve as a compass for business decisions.
Thursday, January 15 (2)

Book review: Connecting the Dots by Milan Janosov about how data, networks and algorithms shape our world.
The inspiring story of leg prosthesis innovation, driven by the experiences and challenges of ultramarathon runners.
Wednesday, January 14 (2)

ThoughtSpot introduces enhanced interactive analytics capabilities on the Snowflake platform, aimed at rapidly deliverin…

Report from Info+, a biennial data visualization conference, held this year at Northeastern University in Boston.
Tuesday, January 13 (3)

Lex Fridman talks with naturalist Paul Rosolie about uncontacted tribes in the Amazon and wildlife conservation.

Book review: Everyday Data Visualization offers a refreshing return to the fundamentals of data visualization.

A technical comparison of DAX performance between limited and regular relationships in Power BI data models.
Monday, January 12 (1)
A practical guide for entrepreneurs on finding growth funding and approaching the right investors.
Sunday, January 11 (1)

Geocoding in Power BI map visuals can slow down reports. Learn how to measure this with Performance Analyzer.
Saturday, January 10 (1)

Storytelling with Data expands the team: vacancy for the SWD team with a focus on data communication.
Friday, January 9 (3)
BNR update on medical AI applications that function as a personal health coach in your pocket.

Performance analysis of regular versus limited relationships in DAX semantic models, with implications for model design.
Just Eat implements embedded analytics to provide deeper insights that go beyond reporting historical performance and ac…
Thursday, January 8 (4)

AI only delivers enterprise value if it is allowed to act: embedding it in the operating model instead of overlaying it.

Turning Mars data into understandable visualizations: how scientific numbers become human understanding.
How the Dutch supercomputer in Eindhoven can compete with Big Tech and what the tech giants can learn from it.
The Power BI Dataviz World Championships are back with three rounds of visualization challenges and a live finale at Fab…
Wednesday, January 7 (1)
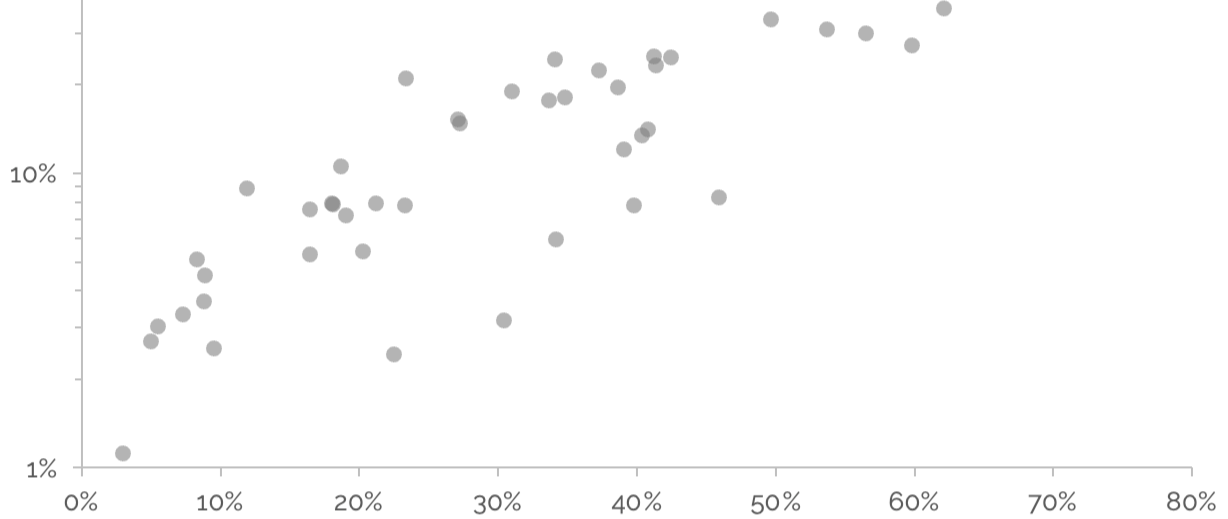
How wrong axis scales distort data stories: Alternatives to logarithmic scales in data visualization.
Tuesday, January 6 (2)
This article provides an overview of the definitions, similarities, and differences between data warehouses, data lakes,…

NVIDIA unveils details of Vera Rubin AI platform: five times the performance of Blackwell for next-gen AI workloads.
Monday, January 5 (3)
ThoughtSpot's Column Sets and Query Sets address the challenge of incorporating business-specific logic that is not suit…
How homework tutoring can be scaled into a scalable business model through a digital platform.

New Year's resolutions for data communication: setting intentions and developing skills with Storytelling with Data.
Sunday, January 4 (1)

Diagnosing DirectQuery performance issues caused by SQL queries returning overly large result sets in Power BI.
Thursday, January 1 (1)
A reflection on the omnipresence of AI and why we still don't fully understand the technology, including its connection …