Wat is Business Intelligence?
Business Intelligence (BI) is een verzamelnaam voor de technologieën, processen en strategieën die organisaties gebruiken om ruwe data om te zetten in bruikbare inzichten. Het doel: betere beslissingen nemen op basis van feiten in plaats van onderbuikgevoel.
BI omvat het hele traject van data verzamelen tot het presenteren van inzichten. Denk aan het ophalen van data uit verschillende systemen (ERP, CRM, webshop), het opschonen en samenvoegen ervan, en het visualiseren in dashboards en rapporten die iedereen in de organisatie kan begrijpen.
De term Business Intelligence bestaat al sinds de jaren '50, maar heeft de afgelopen tien jaar een enorme vlucht genomen. Dankzij moderne tools zoals Power BI, Tableau en Qlik is BI niet langer voorbehouden aan grote ondernemingen met diepe zakken — ook het MKB kan er volop mee aan de slag.
De BI-stack: van data naar beslissing
Een complete BI-oplossing bestaat uit meerdere lagen die samenwerken. Dit noemen we de BI-stack:
- Databronnen — De systemen waar je ruwe data vandaan komt: ERP-systemen (SAP, Exact), CRM (Salesforce, HubSpot), databases, Excel-bestanden, API's van webdiensten, IoT-sensoren en meer.
- ETL / Data-integratie — Extract, Transform, Load: het proces waarmee data uit bronnen wordt opgehaald, opgeschoond, getransformeerd en geladen in een centraal opslagsysteem. Tools: Azure Data Factory, SSIS, Fivetran, dbt.
- Data Warehouse / Lakehouse — De centrale opslag waar alle getransformeerde data samenkomt. Geoptimaliseerd voor snelle queries en analyses. Voorbeelden: Azure Synapse, Snowflake, Google BigQuery, Microsoft Fabric Lakehouse.
- Datamodel / Semantische laag — Een gestructureerde laag die de relaties tussen tabellen definieert en berekeningen (measures, KPI's) vastlegt. Dit zorgt ervoor dat iedereen dezelfde definities gebruikt. In Power BI is dit het tabular model met DAX.
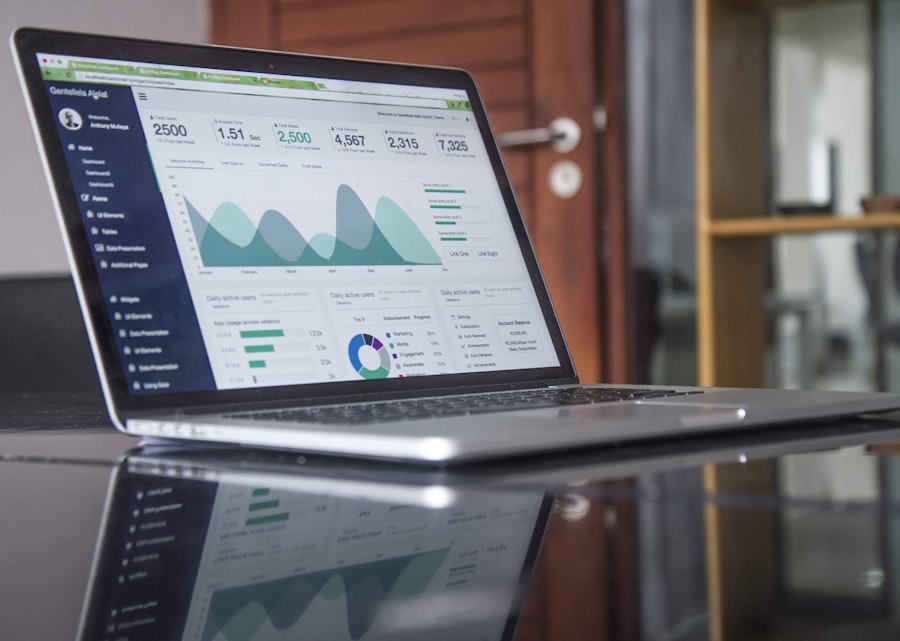
- Visualisatie / Rapportage — De laag die gebruikers zien: interactieve dashboards, rapporten, scorecards. Hier worden de inzichten tastbaar gemaakt met grafieken, tabellen en KPI-indicatoren.
- Consumptie / Actie — De eindgebruikers bekijken rapporten, stellen vragen, exporteren data en nemen beslissingen. Steeds vaker worden inzichten ook geautomatiseerd verwerkt via alerts en triggers.
Voorbeelden uit de praktijk
BI wordt in vrijwel elke sector toegepast. Hier zijn concrete Nederlandse voorbeelden:
- Retail (Albert Heijn, Jumbo) — Supermarkten gebruiken BI om voorraadniveaus per filiaal te monitoren, promo-effectiviteit te meten, en klantgedrag te analyseren op basis van bonuskaart-data. Resultaat: minder verspilling, betere schapindeling, gerichtere aanbiedingen.
- Zorg — Ziekenhuizen en huisartsenpraktijken zetten BI in voor wachttijdanalyse, bezettingsgraden van bedden, en kwaliteitsindicatoren. Het RIVM gebruikt BI-dashboards voor monitoring van infectieziekten en vaccinatiegraad.
- Overheid — Gemeenten publiceren open data-dashboards voor burgers: criminaliteitscijfers, luchtkwaliteit, woningbouw-voortgang. De Rijksoverheid gebruikt BI voor begrotingsmonitoring en beleidseffectmetingen.
- Finance — Banken en verzekeraars gebruiken BI voor risico-analyse, fraude-detectie, klant-segmentatie en compliance-rapportages. Real-time dashboards monitoren transactievolumes en afwijkingen.
- Logistiek — Transportbedrijven analyseren routes, levertijden, brandstofverbruik en voertuigbezetting. PostNL en DHL gebruiken BI-dashboards om de hele keten van sorteercentrum tot voordeur te monitoren.
BI vs. Data Analytics vs. Data Science
De termen worden vaak door elkaar gebruikt, maar er zijn belangrijke verschillen:
| Business Intelligence | Data Analytics | Data Science | |
|---|---|---|---|
| Vraag | Wat is er gebeurd? | Waarom is het gebeurd? | Wat gaat er gebeuren? |
| Focus | Rapportage & monitoring | Analyse & verklaring | Predictie & modellering |
| Output | Dashboards, KPI's | Inzichten, aanbevelingen | Modellen, algoritmes |
| Gebruiker | Manager, analist | Data-analist | Data scientist |
| Tools | Power BI, Tableau, Qlik | SQL, Python, R | Python, TensorFlow, scikit-learn |
In de praktijk overlappen deze disciplines steeds meer. Moderne BI-tools zoals Power BI integreren steeds vaker analytics- en AI-functionaliteit, waardoor de grenzen vervagen.
Populaire BI-tools in Nederland
De Nederlandse markt wordt gedomineerd door een handvol tools. Hier is een overzicht van de populairste BI-platforms:
- Microsoft Power BI — Marktleider, sterk geïntegreerd met het Microsoft-ecosysteem (Excel, Teams, SharePoint, Azure). Gratis Desktop-versie, Pro vanaf €9,40/maand. Zeer populair in het Nederlandse MKB en enterprise. Lees meer over Power BI.
- Tableau — Bekend om zijn krachtige visualisatiemogelijkheden en intuïtieve drag-and-drop interface. Eigendom van Salesforce. Sterk in exploratieve analyses. Prijzen starten vanaf $75/gebruiker/maand.
- Qlik Sense — Nederlandse roots (opgericht in Lund, maar groot kantoor in Nederland). Unieke associatieve engine die automatisch relaties in data ontdekt. Populair bij technisch ingestelde organisaties.
- Looker (Google Cloud) — Cloud-native BI-platform met een unieke modelleringslaag (LookML). Sterk voor organisaties die al op Google Cloud zitten. Minder gangbaar in Nederland dan Power BI of Tableau.
- SAP Analytics Cloud — De BI-oplossing voor organisaties die zwaar leunen op SAP. Combineert BI, planning en predictive analytics in één platform. Vooral in gebruik bij grote enterprises.
- ThoughtSpot — Innovatieve tool waarbij je vragen stelt in natuurlijke taal en direct antwoorden krijgt. AI-first benadering. Groeiend in populariteit, vooral bij organisaties die self-service BI willen maximaliseren.
BI-trends in 2026
De BI-wereld ontwikkelt zich snel. Dit zijn de belangrijkste trends voor 2026:
- AI-gedreven analytics — Grote taalmodellen (LLM's) worden geïntegreerd in BI-tools. Gebruikers kunnen vragen stellen in natuurlijke taal ("Wat was onze omzet in Q3 vergeleken met vorig jaar?") en krijgen direct visualisaties terug. Microsoft Copilot in Power BI is hier een voorbeeld van.
- Self-service BI — De verschuiving van IT-gedreven rapportage naar gebruikers die zelf hun analyses maken, versnelt. Tools worden steeds gebruiksvriendelijker, maar data governance wordt belangrijker om wildgroei te voorkomen.
- Unified data platforms — De grens tussen data warehouse, data lake en BI vervaagt. Platforms zoals Microsoft Fabric, Databricks en Snowflake bieden alles in één: opslag, transformatie, analyse en visualisatie.
- Real-time BI — Organisaties willen niet meer wachten op nachtelijke batch-updates. Real-time dashboards die direct veranderingen tonen worden de norm, gedreven door streaming-technologieën zoals Kafka en EventHubs.
- Data governance & data mesh — Met de groei van self-service BI groeit ook de behoefte aan governance: wie mag welke data zien? Welke definities gebruiken we? Data mesh-architectuur decentraliseert data-eigenaarschap naar domeinen.
- Embedded analytics — BI-inzichten worden steeds vaker direct ingebouwd in de applicaties die mensen dagelijks gebruiken: CRM, ERP, HR-systemen. Geen apart dashboard meer openen, maar inzichten precies waar je ze nodig hebt.